
Descriptive statistics and inferential statistics are two different branches of statistics that are used to analyze and interpret data. While both methods are used to make sense of data, there are key differences between the two that distinguish them from one another

Descriptive statistics is used to describe and summarize data, and is often used to provide a general overview of a dataset. Descriptive statistics techniques include measures of central tendency (such as the mean, median, and mode) and measures of dispersion (such as standard deviation and range). These measures provide a snapshot of the data and help to identify patterns and trends.
Inferential statistics, on the other hand, is used to make inferences about a population based on a sample of data. Inferential statistics techniques include hypothesis testing, correlation analysis, and regression analysis. These methods allow researchers to make predictions about the population based on the sample data, and to estimate the degree of uncertainty associated with these predictions.
Desktop Specialist
Learn more about Desktop Specialist Certification.
Data Analyst
Learn more about the Data Analyst Certification.
Server Certified
Learn more about the Tableau Server Certification.
Ready to contribute to the Tableau community? Get $30 for sharing your work and certification experiences. Write and get paid for every article. Learn more »
What is Descriptive Statistics?
Descriptive statistics is a branch of statistics that is used to summarize and describe data. The goal of descriptive statistics is to provide a general overview of a dataset, and to identify patterns and trends within the data. By using descriptive statistics, researchers can gain a better understanding of their data and make informed decisions based on the information they have collected.
Keep on Reading: Tableau Data Analyst Certification Questions »
There are several different types of descriptive statistics, including measures of central tendency and measures of dispersion. Measures of central tendency include the mean, median, and mode, and are used to identify the center of a dataset. The mean is the average of all the values in a dataset, the median is the middle value when the data is arranged in numerical order, and the mode is the most frequently occurring value in a dataset.
Measures of dispersion, on the other hand, are used to describe how spread out the data is. Some examples of measures of dispersion include the range, variance, and standard deviation. The range is the difference between the highest and lowest values in a dataset, the variance is a measure of the spread of the data around the mean, and the standard deviation is a measure of how much the data deviates from the mean.
Another important aspect of descriptive statistics is data visualization. Data visualization techniques such as histograms, bar charts, and scatter plots are used to present data in a clear and easy-to-understand format. These techniques allow researchers to quickly identify patterns and trends within the data, and to communicate their findings to others in a clear and concise manner.
Descriptive statistics also include measures of shape such as skewness and kurtosis. Skewness is a measure of the symmetry of the data distribution, while kurtosis is a measure of the peakedness of the data distribution.
It is important to note that descriptive statistics is not the same as inferential statistics. Descriptive statistics is used to summarize and describe the data as it is, while inferential statistics is used to make predictions about a population based on a sample of data.
In conclusion, descriptive statistics is a branch of statistics that is used to summarize and describe data. By using descriptive statistics techniques such as measures of central tendency and measures of dispersion, researchers can gain a better understanding of their data and make informed decisions based on the information they have collected. Additionally, data visualization techniques allow researchers to quickly identify patterns and trends within the data and communicate their findings to others in a clear and concise manner.
What is Inferential Statistics?
Inferential statistics is a branch of statistics that is used to make inferences about a population based on a sample of data. The goal of inferential statistics is to estimate population parameters using sample statistics and to make predictions about the population based on the sample data. By using inferential statistics, researchers can draw conclusions about a population based on a sample of data and make decisions with a degree of uncertainty.
Keep reading: Tableau Desktop Specialist Certification Questions »
One of the key techniques used in inferential statistics is hypothesis testing. A hypothesis is a statement or assumption about a population parameter, and hypothesis testing is used to determine whether the sample data supports or refutes the hypothesis. Hypothesis testing involves setting up a null hypothesis and an alternative hypothesis, and then using statistical methods to determine the likelihood of observing the sample data if the null hypothesis were true.
Another important technique in inferential statistics is estimation. Estimation is the process of using sample data to make predictions about population parameters. The most common method of estimation is the sample mean, which is used to estimate the population mean. Other methods of estimation include the maximum likelihood estimate and the method of moments.
Inferential statistics also includes techniques such as correlation analysis and regression analysis. Correlation analysis is used to determine the strength and direction of the relationship between two variables, while regression analysis is used to predict the value of one variable based on the value of another variable.
It is important to note that inferential statistics is not the same as descriptive statistics. Descriptive statistics is used to summarize and describe the data as it is, while inferential statistics is used to make predictions about a population based on a sample of data. Additionally, inferential statistics involves making predictions and drawing conclusions with a degree of uncertainty, whereas descriptive statistics simply describes what is observed in the data.
In conclusion, inferential statistics is a branch of statistics that is used to make inferences about a population based on a sample of data. By using techniques such as hypothesis testing, estimation, correlation analysis, and regression analysis, researchers can draw conclusions about a population and make predictions with a degree of uncertainty. Additionally, inferential statistics allows researchers to make predictions about populations based on sample data, whereas descriptive statistics is used to summarize and describe the data as it is.
What are the Types of Descriptive Statistics?
Descriptive statistics is a branch of statistics that is used to summarize and describe data. There are several different types of descriptive statistics, each with its own unique purpose and application. Some of the most common types of descriptive statistics include measures of central tendency, measures of dispersion, and measures of shape.
Measures of central tendency are used to identify the center of a dataset. The most common measures of central tendency are the mean, median, and mode. The mean is the average of all the values in a dataset and is calculated by summing all the values and dividing by the number of observations. The median is the middle value when the data is arranged in numerical order and is used when the data is not symmetric or has extreme values. The mode is the most frequently occurring value in a dataset, and is used when the data is categorical in nature.
Measures of dispersion are used to describe how spread out the data is. Some examples of measures of dispersion include the range, variance, and standard deviation. The range is the difference between the highest and lowest values in a dataset, the variance is a measure of the spread of the data around the mean, and the standard deviation is a measure of how much the data deviates from the mean.
Measures of shape are used to describe the shape of the data distribution. Some examples of measures of shape include skewness and kurtosis. Skewness is a measure of the symmetry of the data distribution and is calculated as the difference between the mean and the mode. Kurtosis is a measure of the peakedness of the data distribution and is calculated as the difference between the mean and the median.
Another important type of descriptive statistics is data visualization. Data visualization techniques such as histograms, bar charts, and scatter plots are used to present data in a clear and easy-to-understand format. These techniques allow researchers to quickly identify patterns and trends within the data, and to communicate their findings to others in a clear and concise manner.
In conclusion, descriptive statistics is a branch of statistics that is used to summarize and describe data. There are several different types of descriptive statistics, including measures of central tendency, measures of dispersion, measures of shape, and data visualization techniques. Each of these types of descriptive statistics has its own unique purpose and application, and they are all used to gain a better understanding of the data and to identify patterns and trends within the data.
What are the Types of Inferential Statistics?
Inferential statistics is a branch of statistics that is used to make inferences about a population based on a sample of data. There are several different types of inferential statistics, each with its own unique purpose and application. Some of the most common types of inferential statistics include hypothesis testing, estimation, correlation analysis, and regression analysis.
Hypothesis testing is a statistical method used to determine whether the sample data supports or refutes a statement or assumption about a population parameter. This process involves setting up a null hypothesis and an alternative hypothesis, and then using statistical methods to determine the likelihood of observing the sample data if the null hypothesis were true.
Estimation is the process of using sample data to make predictions about population parameters. The most common method of estimation is the sample mean, which is used to estimate the population mean. Other methods of estimation include the maximum likelihood estimate and the method of moments.
Correlation analysis is used to determine the strength and direction of the relationship between two variables. This can be done through the calculation of a correlation coefficient, which ranges from -1 to 1, with -1 indicating a perfect negative correlation, 0 indicating no correlation, and 1 indicating a perfect positive correlation.
Regression analysis is used to predict the value of one variable based on the value of another variable. This can be done by fitting a linear or non-linear equation to the data, and using this equation to make predictions about future values. Regression analysis can also be used to identify the relative importance of different variables in explaining the variation in the data.
Another type of inferential statistics is Bayesian statistics which is based on Bayes’ theorem, that uses prior probability and the likelihood of the data to update the probability of hypotheses. This method allows for incorporating subjective knowledge and prior information about the problem.
It is important to note that inferential statistics is not the same as descriptive statistics. Descriptive statistics is used to summarize and describe the data as it is, while inferential statistics is used to make predictions about a population based on a sample of data and make conclusions with a degree of uncertainty.
In conclusion, inferential statistics is a branch of statistics that is used to make inferences about a population based on a sample of data. There are several different types of inferential statistics, including hypothesis testing, estimation, correlation analysis, regression analysis and Bayesian statistics. Each of these types of inferential statistics has its own unique purpose and application, and they are all used to make predictions about populations and draw conclusions with a degree of uncertainty.
What are the Differences Between Descriptive and Inferential Statistics?
Descriptive statistics and inferential statistics are two different branches of statistics that are used to analyze and interpret data. While both methods are used to make sense of data, there are key differences between the two that distinguish them from one another.
Descriptive statistics is used to describe and summarize data, and is often used to provide a general overview of a dataset. Descriptive statistics techniques include measures of central tendency (such as the mean, median, and mode) and measures of dispersion (such as standard deviation and range). These measures provide a snapshot of the data and help to identify patterns and trends.
Inferential statistics, on the other hand, is used to make inferences about a population based on a sample of data. Inferential statistics techniques include hypothesis testing, correlation analysis, regression analysis, and Bayesian statistics. These methods allow researchers to make predictions about the population based on the sample data, and to estimate the degree of uncertainty associated with these predictions.
One key difference between descriptive and inferential statistics is the level of analysis. Descriptive statistics is used to summarize and describe the data as it is, while inferential statistics is used to make predictions about a population based on a sample of data. This means that descriptive statistics provides a general overview of the data, while inferential statistics allows for more precise estimates and predictions.
Another key difference between the two is the level of precision. Descriptive statistics provides a general overview of the data, while inferential statistics allows for more precise estimates and predictions. This is because inferential statistics takes into account the uncertainty associated with the sample data, and provides a measure of the degree of confidence that the predictions are accurate.
In terms of measurement techniques, descriptive statistics typically involves calculating measures such as mean, median, mode, standard deviation, and range. Inferential statistics, on the other hand, typically involves conducting hypothesis tests, correlation analysis, regression analysis and Bayesian statistics.
In summary, descriptive statistics and inferential statistics are two different branches of statistics that are used to analyze and interpret data. Descriptive statistics is used to describe and summarize data, while inferential statistics is used to make predictions about a population based on a sample of data. While both methods are used to make sense of data, there are key differences between the two that distinguish them from one another. Descriptive statistics provides a general overview of the data, while inferential statistics allows for more precise estimates and predictions.
Get our Most Popular Downloads
Download the most popular scenario-based Tableau Workbooks in .twbx format. Used by thousands of Tableau developers and job aspirants every day to improve and fine-tune their CV and Tableau Public profile. Join the largest Tableau Experts Social Group.
Banking & Financial Dataset Analysis
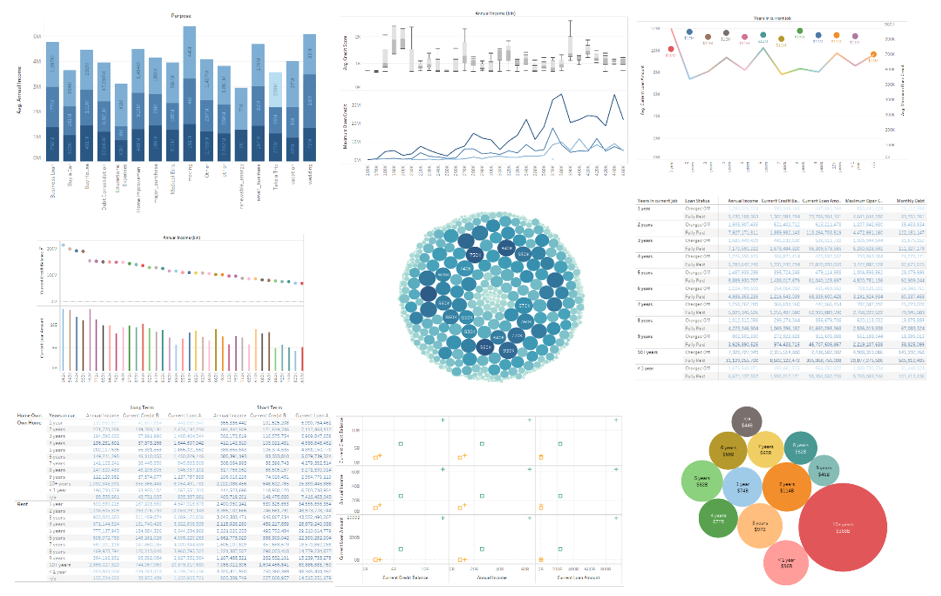
Financial Domain Tableau Dataset and Analysis. The most important domain in today’s industry. Analyze Key Performance Indicators. Discover Risky and Fraudulent Outliers. Download the Tableau Packaged (.twbx) Workbook. Includes a complete Financial dataset analysis. Enhance your Data Analytics experience with our skilled analysis.
Healthcare & Hospital Dataset Analysis
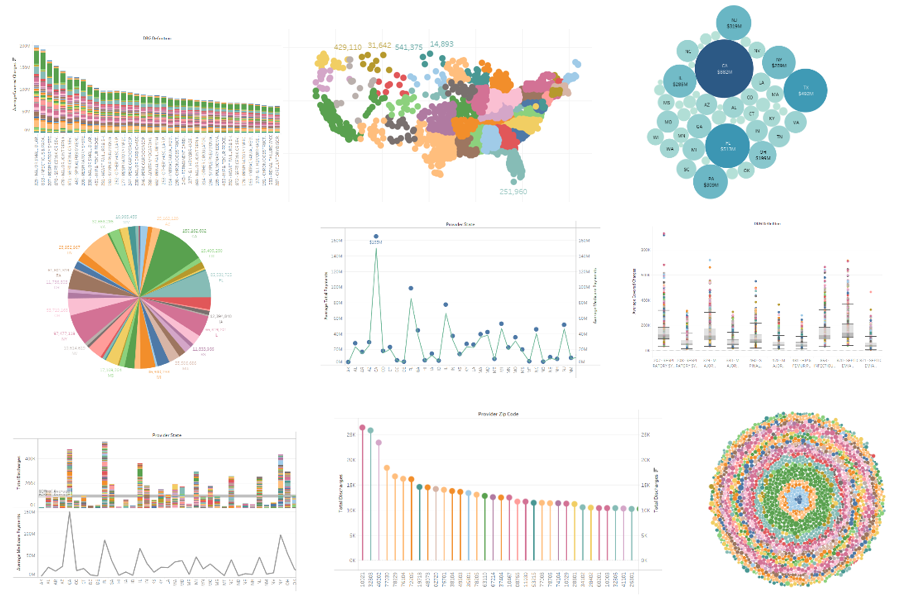
Hospital and Healthcare Domain Tableau Dataset and Analysis. A key field of study with millions of lives at stake. The most sensitive industry today. Download the Tableau Packaged (.twbx) Workbook. Understand how healthcare datasets work. Includes a complete Healthcare dataset with analytical charts. Explore Tableau interactive features with this download.

Insurance Dataset Analysis
Insurance Domain Tableau Dataset and Analysis. Important domain specific metrics and data. Learn how to visualize important metrics. Show outliers and insightful data points. Download the Tableau Packaged (.twbx) Workbook. Includes comprehensive analysis of Insurance data of a large sample population. Uses industry standard analytical practices.


First Working Day of the Quarter
Get the Tableau Workbook identifying the First Working Day of any Quarter of a Year.

By the Editorial Team


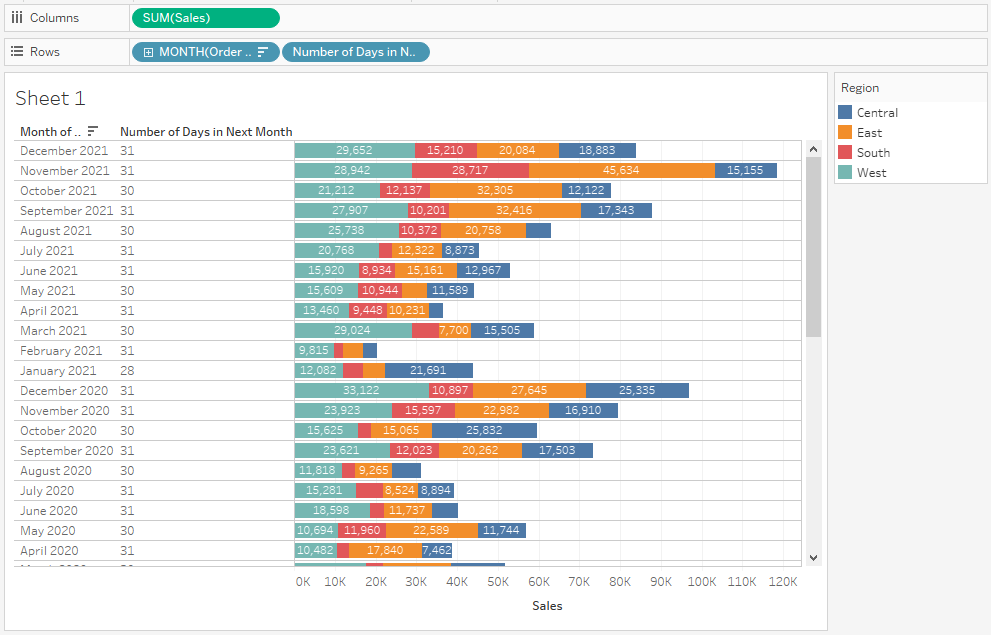


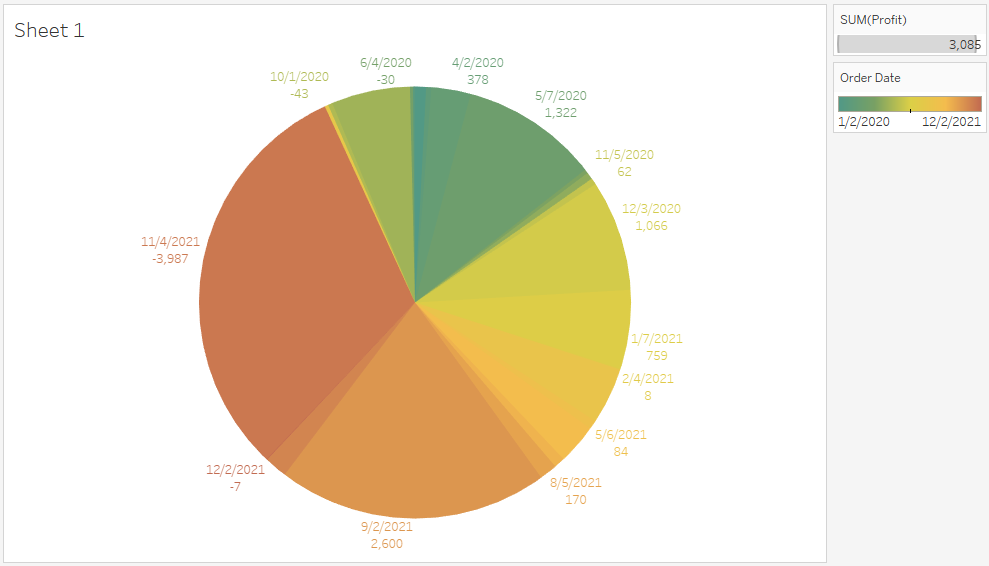
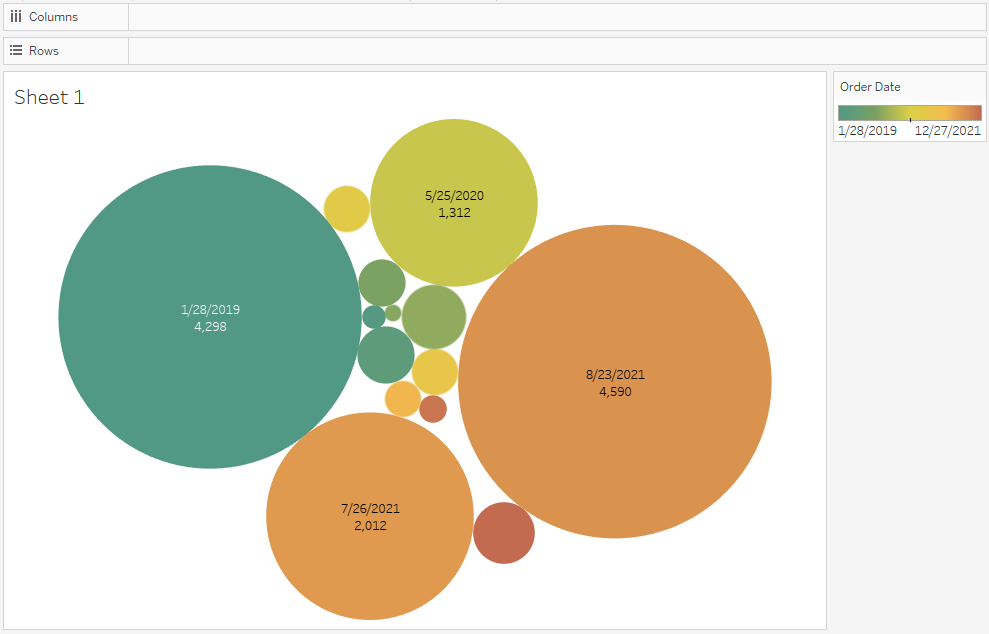
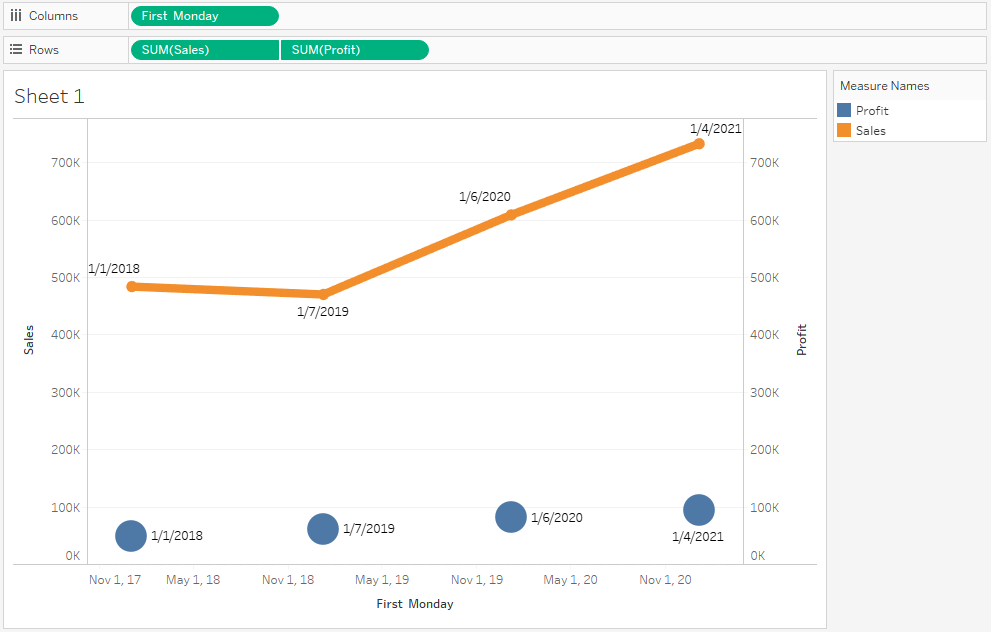

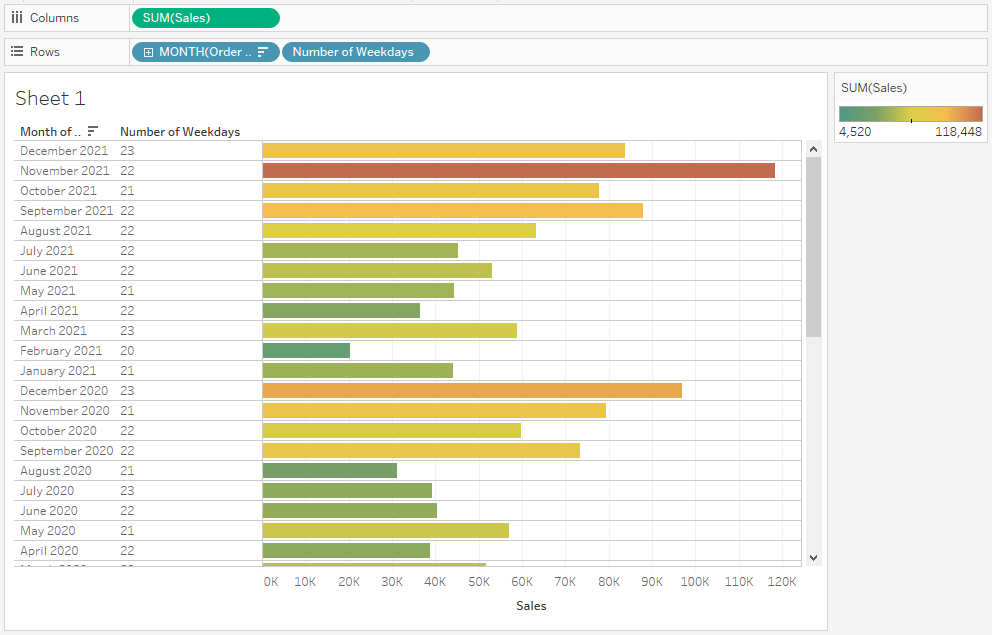


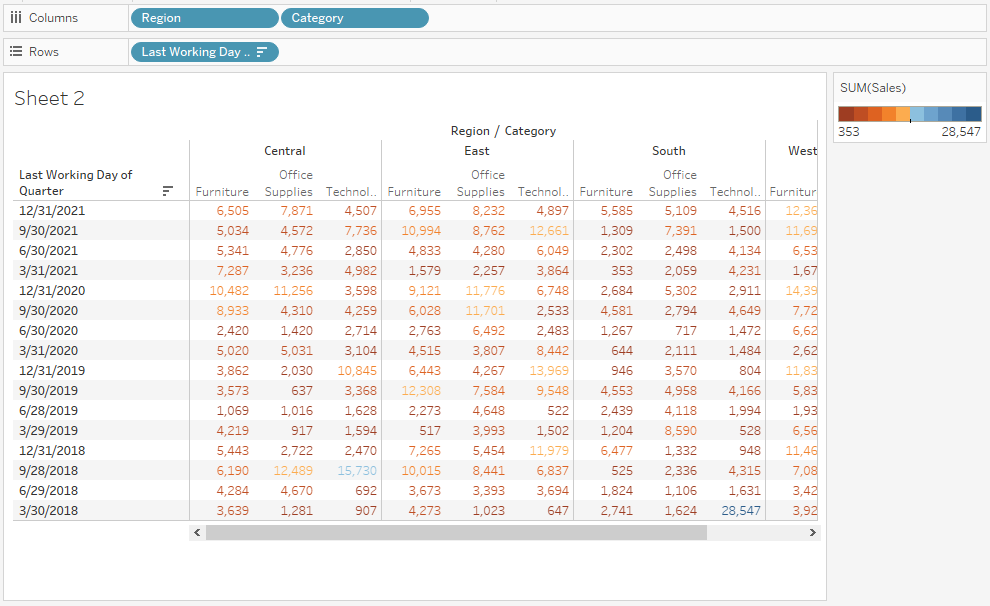


Tableau Practice Test
The best Tableau practice exams built. Period. Explore definitive practical problems created by brilliant Tableau experts.