Overview
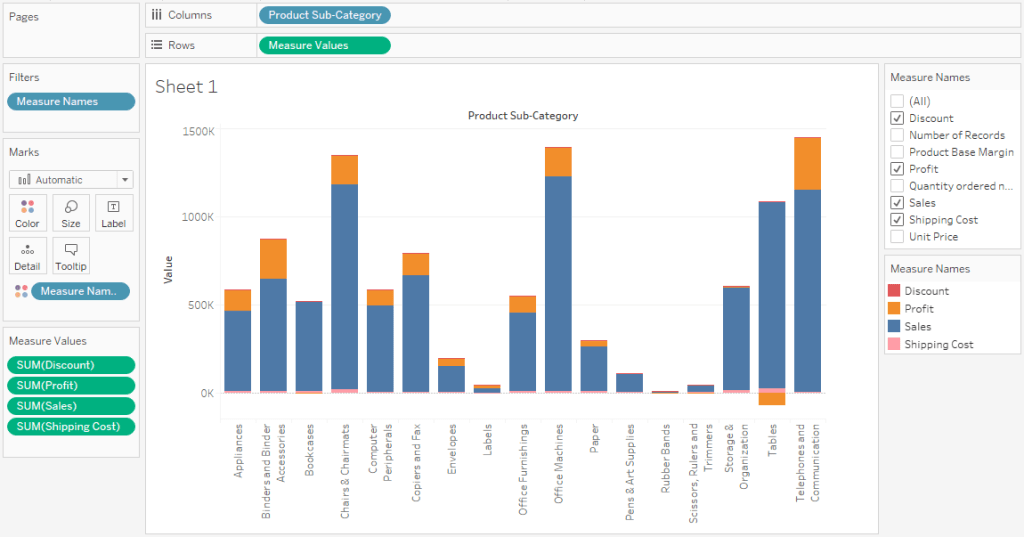
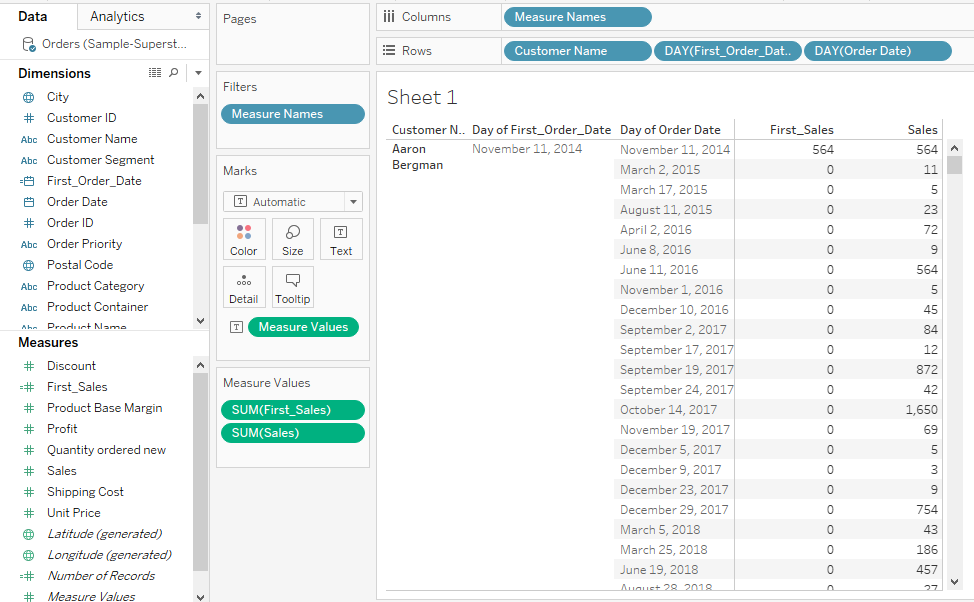
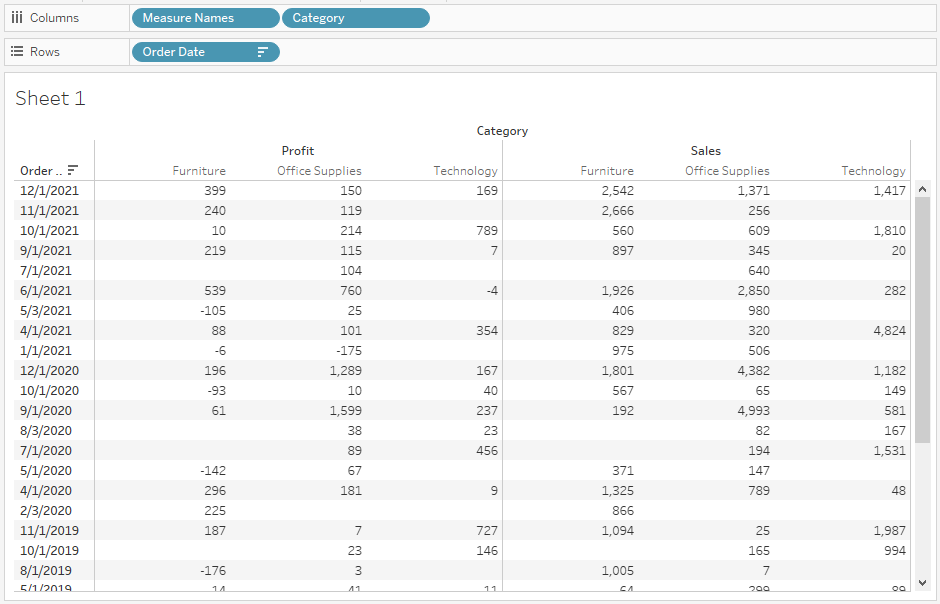
Presenting raw data in a table on Tableau without sorting it first is kind of a messy thing to do. Seeing just endless rows with data, scrolling up and down, hoping to spot a higher number of sales compared to other rows is just a waste of time. An easy and smart thing to do is to sort your table based on your needs – in a descending sort order or an ascending sort order, based on a measure of your choice.
Read more: Show and Hide Button in Tableau »

How to Sort in Tableau
Thanks to Tableau, the process to sort a single table in Tableau Desktop has never been easier. There are even multiple methods on how you can do that.
- The most straightforward one – click on the Sort button in your top menu.

- Click on the Sort button that appears next to the header of your column or row.
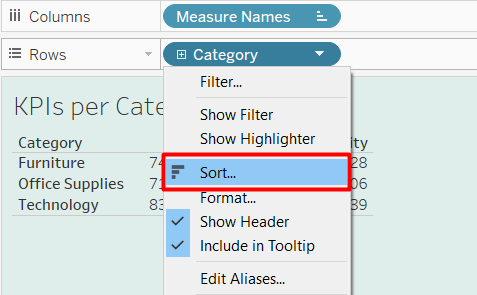
- Directly right-click on the dimensions in the Rows or Columns panel and choose Sort.
What I just described it’s a perfect scenario. You have only one table, and you need that one sorted out. But in practice, our dashboards consist of multiple tables, which you would like to sort all together with only one click. Any other way to sort would be inconvenient for the end-user. This is where things get tricky.
Keep reading: Tableau Data Analyst Certification Questions »
In this case, using only a sorting button is not an option. But still, there is a little workaround that makes all of this possible. In fact, it is only a 3 step process:
- First, creating a parameter
- Second, a calculated field with the RANK() function
- Connecting the dots
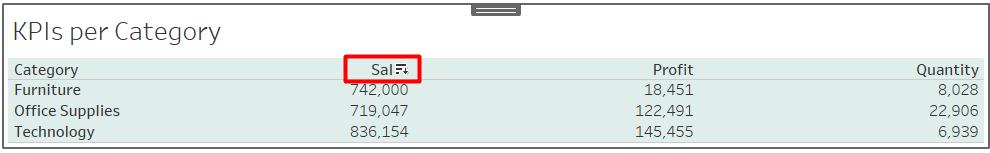
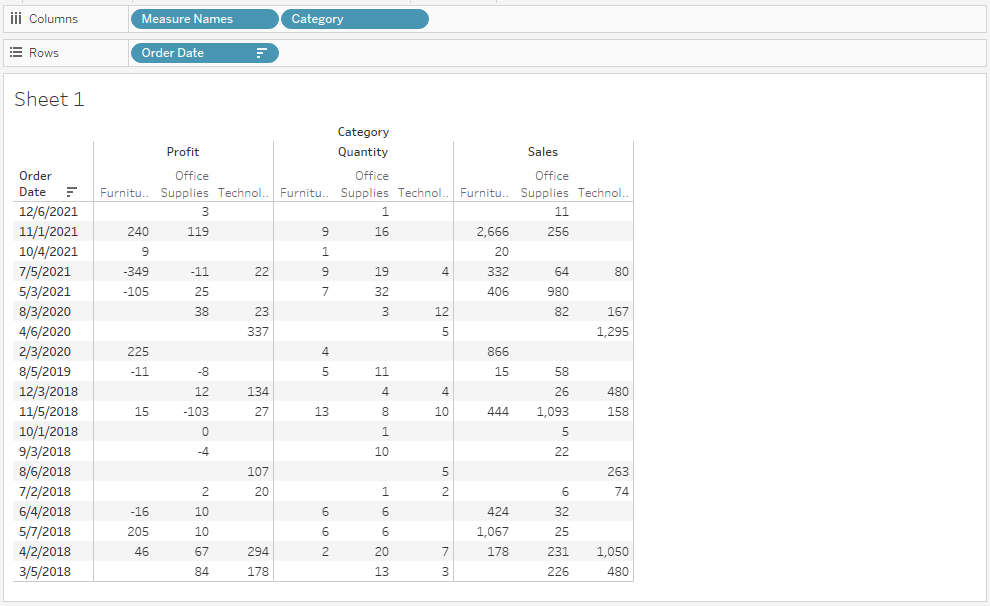
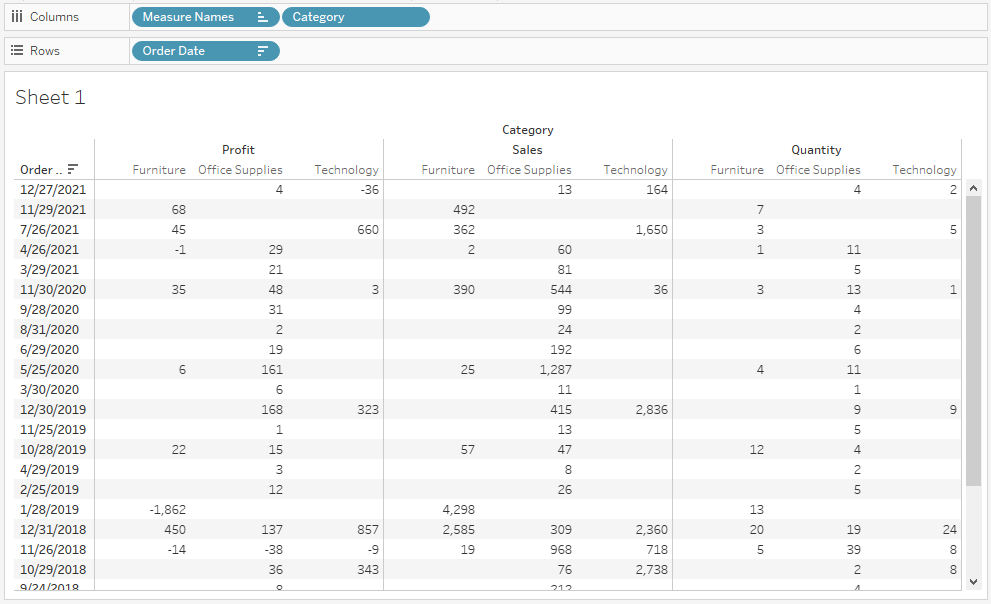
For the sake of practice, I will use the Superstore data from Tableau. We will design a dashboard where we will include three different tables, with three measures in each: Sales, Quantity, and Profit.
The main aim is to design a way how we can sort all three tables by one of the three measures by clicking only once.
Step 1: Creating a Parameter
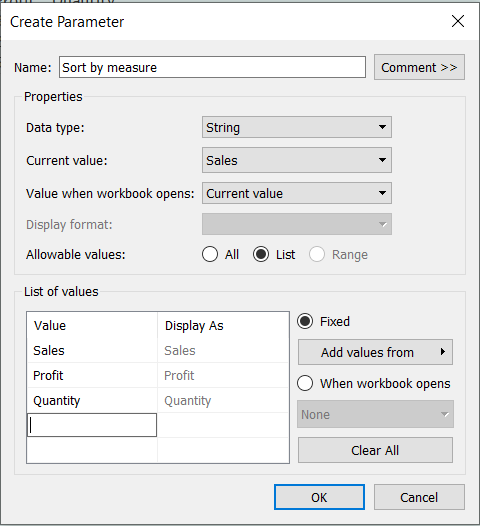
We start off with a parameter. In order to create one, right-click on a blank space in your Data Pane on the left, or go to the little dropdown that appears right of the search field in your Data pane. Choose the option Create Parameter.
Keep on reading: Tableau Desktop Specialist Certification Questions »
As a data type, we will choose String, even though you can choose Integer as well. We will name our parameter Sort by measure so it can be pretty self-explanatory by itself. Next, we need to choose a List, so we can list all three measures that we want to have the ability to sort by.
Step 2: Create a Calculated Field
Next, we need to create a calculated field. In it, we will use two functions. First, we need the CASE WHEN function, which will create a correlation between the calculated field and the parameter – based on each condition, this function calls our parameter and checks what is in it. After Tableau finds the appropriate condition for the chosen option in the parameter, we need a RANK function for all three measures that will do the sorting job.
Even though Tableau offers many different rank functions, in our case, we will use the variant RANK_UNIQUE(). Therefore, this function will allocate a different rank function for each of the three measures in our tables. Even if we have the same number for a different measure, the functions will still designate two different ranks.
Basically, we aim to use this ranking of our dimensions as a field to sort our tables by. That’s why we will create our calculated field as follows:
CASE [Sort by measure]
WHEN ‘Sales’ THEN RANK_UNIQUE (SUM([Sales]), ‘desc’)
WHEN ‘Quantity’ THEN RANK_UNIQUE (SUM([Quantity]), ‘desc’)
WHEN ‘Profit’ THEN RANK_UNIQUE (SUM([Profit]), ‘desc’)
END
The calculated field, designed like this, can sort the tables only in descending order. That is because, in most of the cases, we want to see the rows with the highest number of sales, quantity, and profit first.
But if you want your end-user to be able to switch the sorting between ascending and descending order, we will need to create an additional parameter named Sorting Order. The data type, again, will be String. As allowed values, we will put Ascending and Descending. Now, instead of the written desc in the calculated field, we will place the freshly created parameter. You need to show this parameter in your dashboard as well.
CASE [Sort by measure]
WHEN ‘Sales’ THEN RANK_UNIQUE (SUM([Sales]),[Sorting Order])
WHEN ‘Quantity’ THEN RANK_UNIQUE (SUM([Quantity]), [Sorting Order])
WHEN ‘Profit’ THEN RANK_UNIQUE (SUM([Profit]), [Sorting Order])
END
Once we are done with the calculation, we click OK and then convert it to discrete by right-clicking on it.
Bonus Tip: Sorting by Measures and Dimensions
We’ve successfully constructed a parameter to sort our sheet’s measurements, but what if the user also wants to sort by State? This may be accomplished by adding State to our parameter and calculated field; however, it will necessitate field type conversion because CASE expressions want all evaluated fields to be the same (string, float, int, etc.).
All of the existing fields in our Sort By Field are floats. Because State is a string, we get an error when we enter it into the CASE expression.
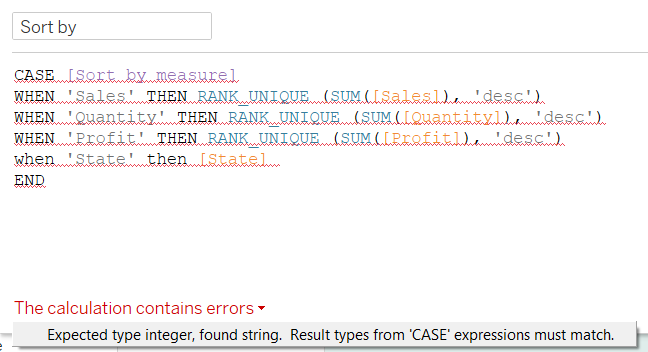
Wrap State in an ASCII() method to convert it to a number to fix this problem.
Also, because the measurements are aggregated, but the State variable is not, we will get a different error. Wrap the expression in a MIN() function to fix this. Any other aggregate function would also work here.
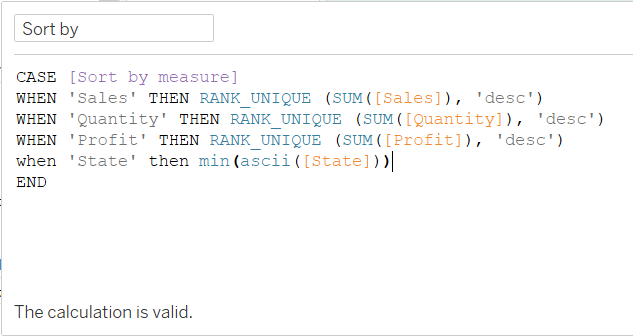
After aggregating State, the CASE statement becomes valid again, and the user may now sort the sheet by any field.
Step 3: Connecting the Dots
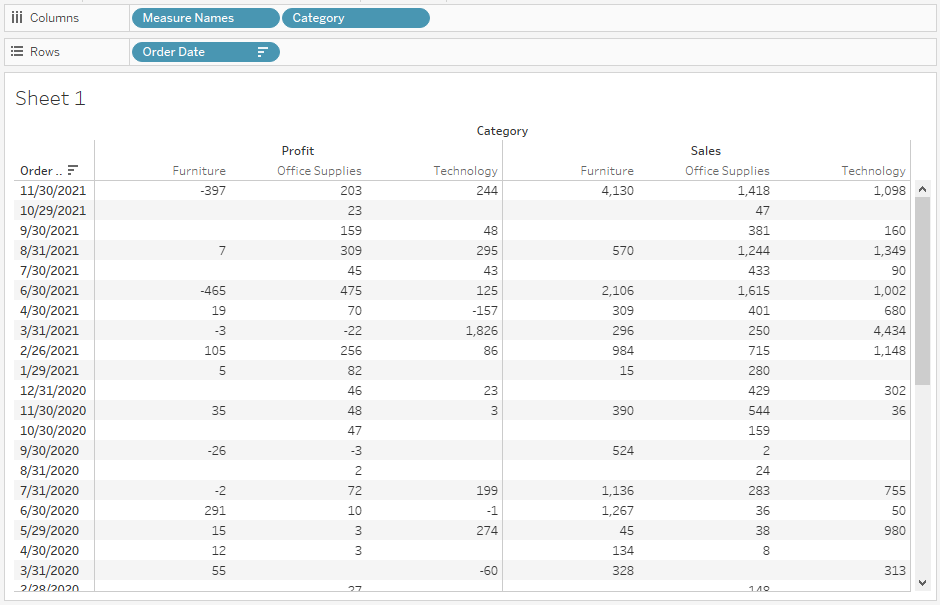
Now, in order to connect the dots, we need to place the newly created calculated field onto Rows into each of our three tables. That way, our table will be listed in numerical order.
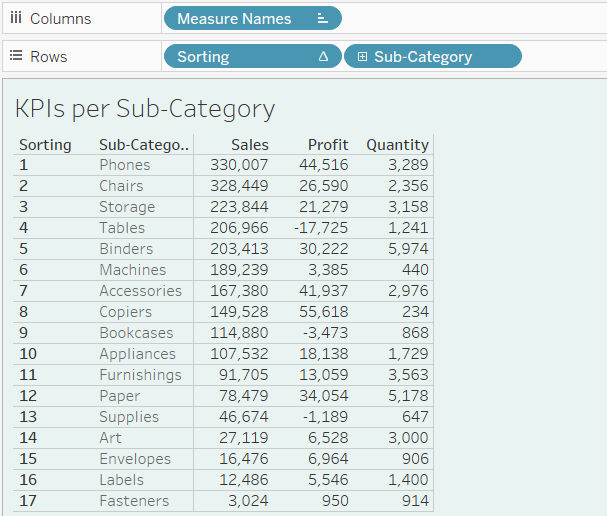
What I don’t like is the visibility of the numerical order. Therefore, I will right-click on the blue Sorting pill and unmark the Show Header. As a result, our table will still remain sorted, but we won’t see the distracting numbers upfront.
Once we repeat the same thing for all of our three tables, we can go to the dashboard itself and show the parameter that we created, or both parameters if we created one for the order as well.
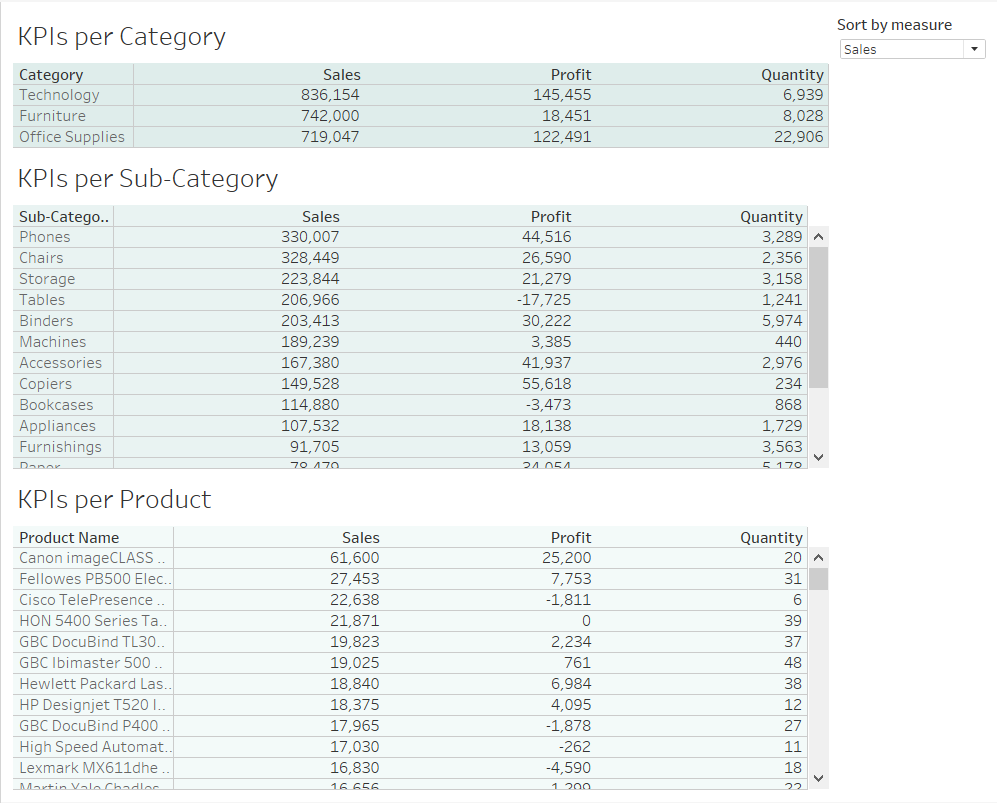
Voila, now we can sort all our tables with only one click.
Improve the User Experience
Till now, we’ve done just the bare essential – we needed a sorting option for multiple tables at once, and we got it. But if you are an experienced analyst and enjoy doing visualization, this is not the end. Now we will go one step further and make the dashboard even more user-friendly and improve the user experience of our end users. In other words, we want to make the sorting option as simple and easy as it can get.
Therefore, we don’t want our user to click on the parameter in the upper right every time when he wants to choose a measure based on which he will sort the tables. Instead, as an improved option, we want to open the possibility of sorting by only clicking directly onto the column’s headers or basically any value of a specific column. Sounds cool, right?
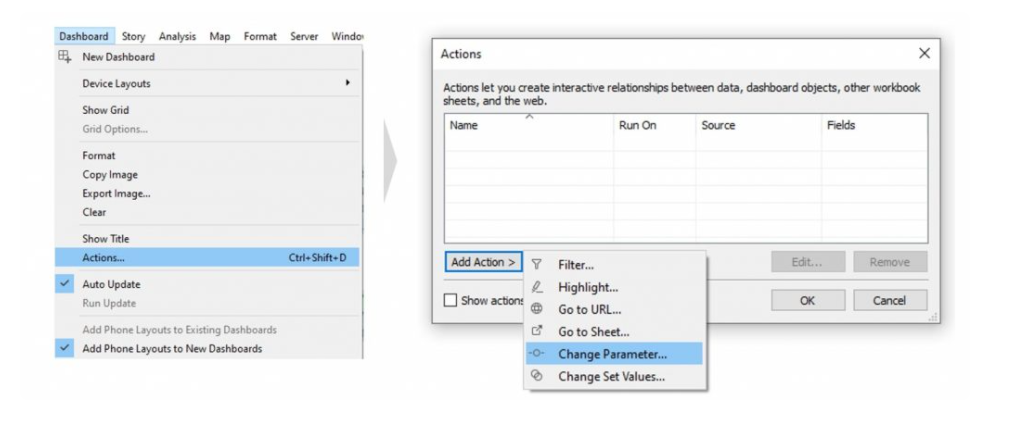
For all of this to be possible, we only need a parameter action that will drive our parameter after we click on something. Therefore, go to the menu item Dashboard and click Actions. After the Actions menu is opened, we need to choose the Change Parameter option.
Let’s go step by step on how to create the parameter actions.
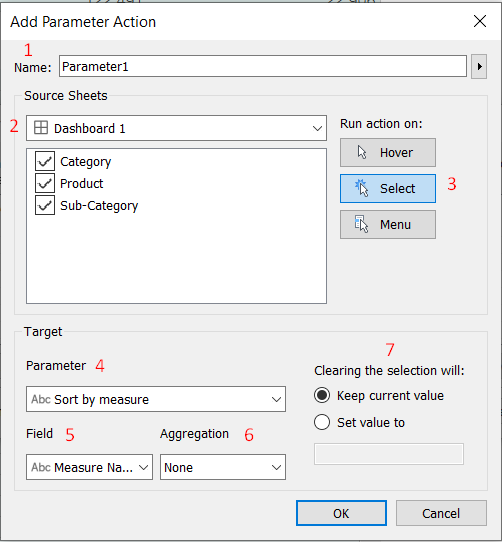
- Give it a name that is self-explanatory for the action itself. Imagine having several actions on a dashboard. If you don’t name them right, your dashboard will become an absolute mess.
- The Source Sheets part wants you to mark all sheets in a particular dashboard on which your parameter is to be applied. In our case, we want all of our three tables to be sorted with this parameter, so we will select them all.
- The Run Action On basically asks you to specify on which action you want the action to be triggered. In this case, Select is the best option. Hover is my favorite, but this option fits great if you need to show additional info, not sort the table by.
- Select the targeted parameter we want to change its value once the end-user clicks.
- Every parameter needs a field that will provide the value for it. So here, select that field. In our case, we will use the header titles of Measure Names, so we can use this field here.
- We don’t require an aggregate for our parameter action because we’ll merely send over the strings of our measurements. So leave the None in place.
- Clearing the selection, in other words, asks: When we deselect the field we were clicking on in our source sheets, what value should the parameter take? Here, we want to keep the last selection. Also, you can choose a particular measure if you want that one to be your default.
Now, let’s click on OK and review our actions. Never click on the X in the upper right because this will discard all the changes that you’ve made.
Now when we click on one of the headers or any other value inside, our parameter on which the four different rank functions are based will be automatically clicked – and all tables will get sorted at once.
Conclusion
Sorting all tables on your dashboard with only one click is what makes a dashboard highly convenient and easy to navigate to users. In this article, we learned how to sort multiple tables by creating only one parameter and one calculated field. Also, we used actions on our behalf to improve the user experience of the dashboard and sort the tables by clicking only on the headers or any value within the column.
Enjoy the awesomeness of your Tableau dashboard.
Get our Most Popular Downloads
Download the most popular scenario-based Tableau Workbooks in .twbx format. Used by thousands of Tableau developers and job aspirants every day to improve and fine-tune their CV and Tableau Public profile. Join the largest Tableau Experts Social Group.
Banking & Financial Dataset Analysis
Financial Domain Tableau Dataset and Analysis. The most important domain in today’s industry. Analyze Key Performance Indicators. Discover Risky and Fraudulent Outliers. Download the Tableau Packaged (.twbx) Workbook. Includes a complete Financial dataset analysis. Enhance your Data Analytics experience with our skilled analysis.
Healthcare & Hospital Dataset Analysis
Hospital and Healthcare Domain Tableau Dataset and Analysis. A key field of study with millions of lives at stake. The most sensitive industry today. Download the Tableau Packaged (.twbx) Workbook. Understand how healthcare datasets work. Includes a complete Healthcare dataset with analytical charts. Explore Tableau interactive features with this download.

Insurance Dataset Analysis
Insurance Domain Tableau Dataset and Analysis. Important domain specific metrics and data. Learn how to visualize important metrics. Show outliers and insightful data points. Download the Tableau Packaged (.twbx) Workbook. Includes comprehensive analysis of Insurance data of a large sample population. Uses industry standard analytical practices.


First Working Day of the Quarter
Get the Tableau Workbook identifying the First Working Day of any Quarter of a Year.

By the Editorial Team


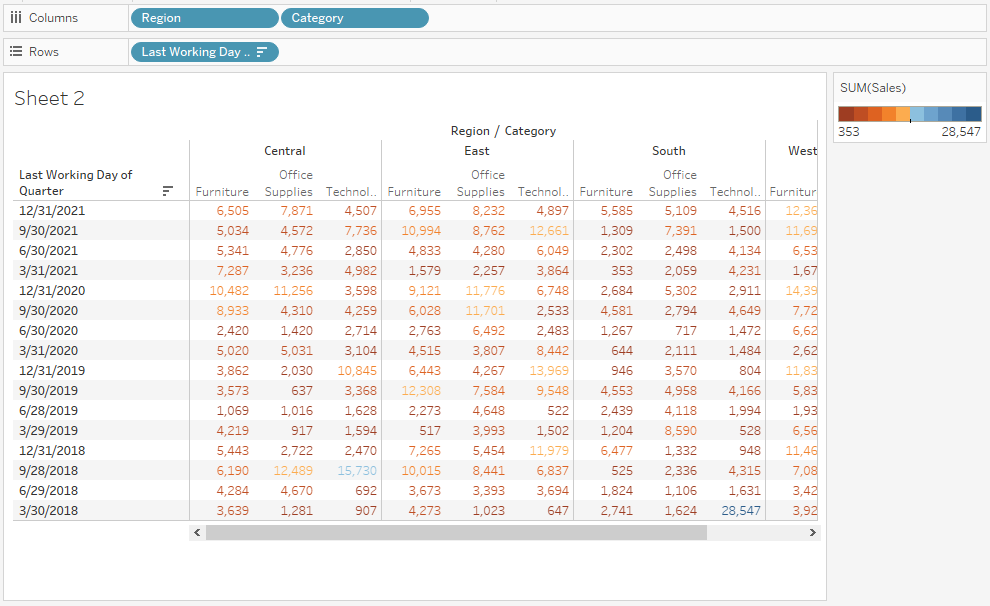


Tableau Practice Test
The best Tableau practice exams built. Period. Explore definitive practical problems created by brilliant Tableau experts.