
Background
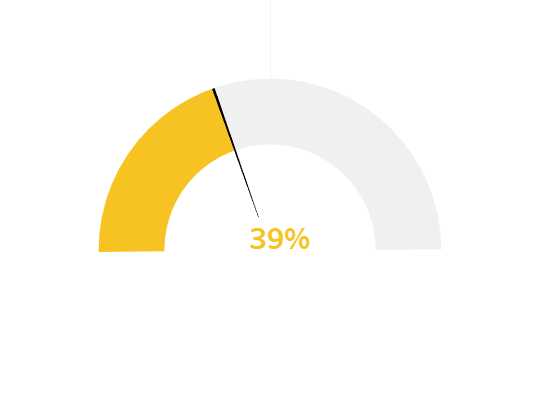
A Thermometer Chart helps to measure the actual value of a well-defined measure. It provides a visual representation of the actual value as compared to a target value, for example the progress of a particular task. A Thermometer Chart is also often described as the linear version of a Gauge Chart. Tableau Desktop provides useful Thermometer Chart designs.
Read more: How to Create Span Chart? »

Steps to Create a Thermometer Chart
Create a Thermometer Chart that shows visually the progress of a value or a task. A Thermometer Chart is also used to demonstrate the status as a percentage of the whole. The filled area is of a darker color than the full range. Download the Thermometer Chart in Tableau Desktop below to explore the logics. Use the Thermometer Chart below in any dataset.

Tableau Desktop Thermometer Chart is a powerful way to depict progress based visualization. Our Certified Tableau Professionals have delicately crafted this Thermometer Chart which can be dynamically modified. Instantly download a ready to use Tableau Workbook .twbx file with a Thermometer Chart. It can be used to measure a single or multiple categories.
Keep reading: Tableau Desktop Specialist Certification Questions »
Why Create a Thermometer Chart
A Thermometer Chart is one of the most useful tools to measure the progress of different measures in a single view. The choice of colors make it a sophisticated tool for many business cases. Various different measures and categories can be measured in Tableau Desktop using Thermometer Charts. Any Tableau Problems and Solution scenarios can be replicated using Thermometer Charts. Insightful visualizations can be derived using Tableau Thermometer Charts in a dashboard. One of the most key aspects of a Thermometer Chart is the performance which is usually pretty good. Businesses of all sizes can benefit from the insights derived out of a Thermometer Chart.
Keep on Reading: Tableau Data Analyst Certification Questions »
Get our Most Popular Downloads
Download the most popular scenario-based Tableau Workbooks in .twbx format. Used by thousands of Tableau developers and job aspirants every day to improve and fine-tune their CV and Tableau Public profile. Join the largest Tableau Experts Social Group.
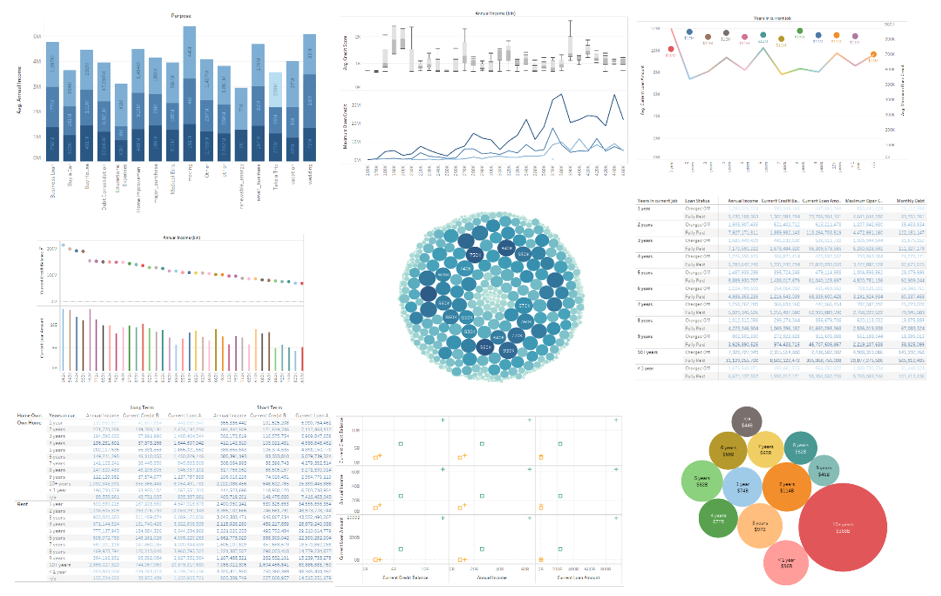
Banking & Financial Dataset Analysis
Financial Domain Tableau Dataset and Analysis. The most important domain in today’s industry. Analyze Key Performance Indicators. Discover Risky and Fraudulent Outliers. Download the Tableau Packaged (.twbx) Workbook. Includes a complete Financial dataset analysis. Enhance your Data Analytics experience with our skilled analysis.
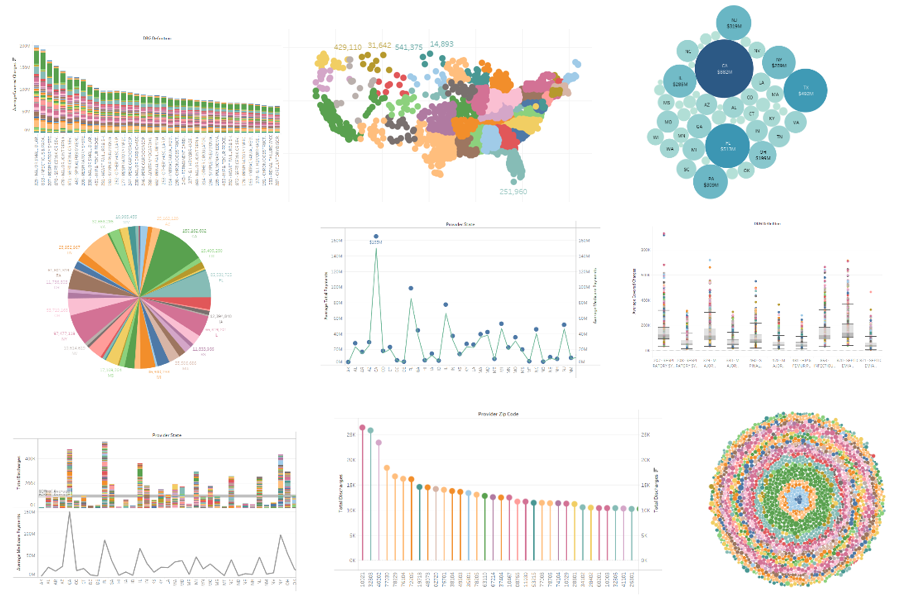
Healthcare & Hospital Dataset Analysis
Hospital and Healthcare Domain Tableau Dataset and Analysis. A key field of study with millions of lives at stake. The most sensitive industry today. Download the Tableau Packaged (.twbx) Workbook. Understand how healthcare datasets work. Includes a complete Healthcare dataset with analytical charts. Explore Tableau interactive features with this download.

Insurance Dataset Analysis
Insurance Domain Tableau Dataset and Analysis. Important domain specific metrics and data. Learn how to visualize important metrics. Show outliers and insightful data points. Download the Tableau Packaged (.twbx) Workbook. Includes comprehensive analysis of Insurance data of a large sample population. Uses industry standard analytical practices.


First Working Day of the Quarter
Get the Tableau Workbook identifying the First Working Day of any Quarter of a Year.

By the Editorial Team


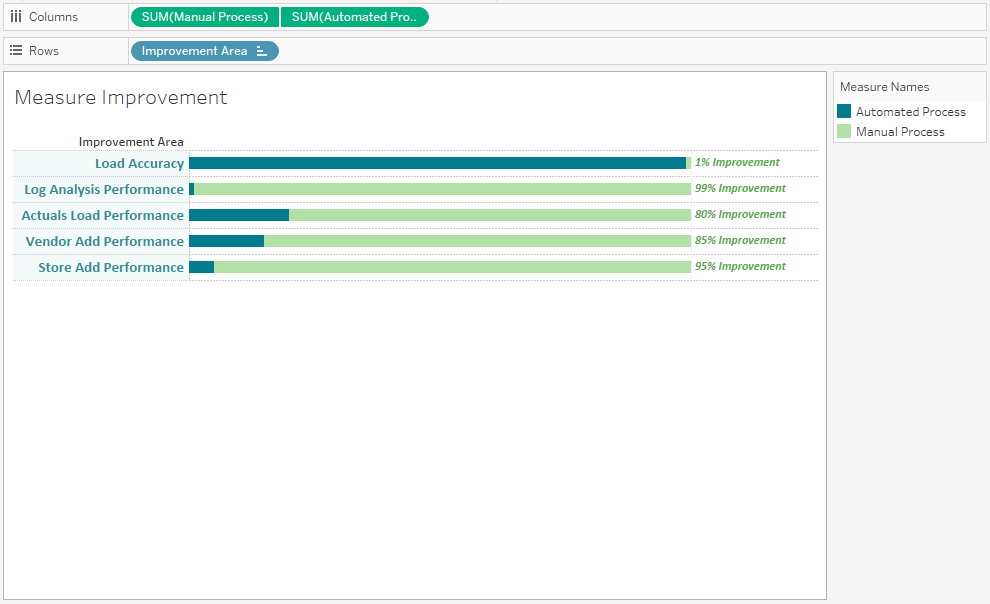


Tableau Practice Test
The best Tableau practice exams built. Period. Explore definitive practical problems created by brilliant Tableau experts.
One thought on “How to Create Thermometer Chart?”